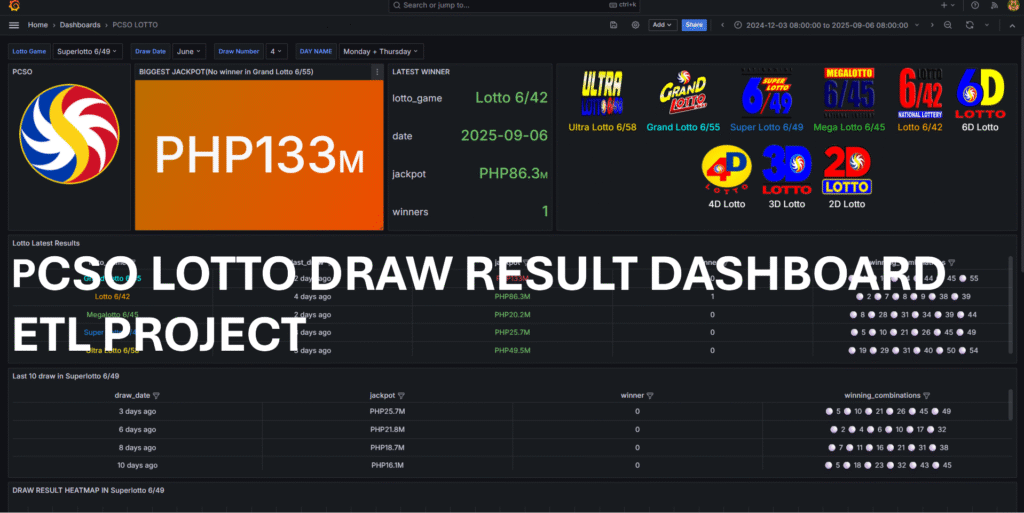
PCSO LOTTO DRAW RESULT DASHBOARD(ETL)
This project is a fully containerized data pipeline that automates web scraping, data storage, and visualization. It leverages AWS services for scalability and reliability, with orchestration managed by Dagster and dashboards powered by Grafana. The design carefully considers AWS Free Tier limits, maximizing its benefits to keep the solution cost-effective while maintaining performance.
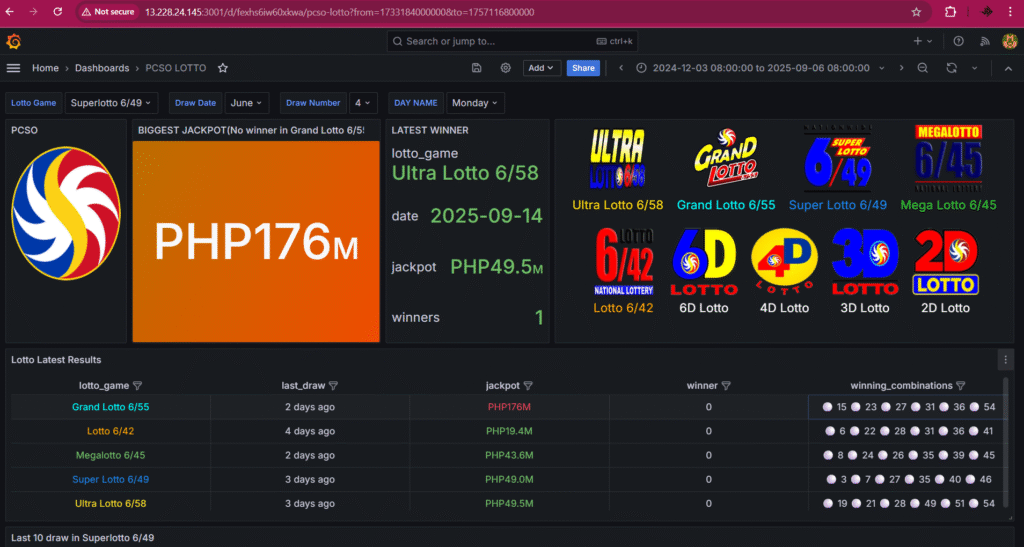
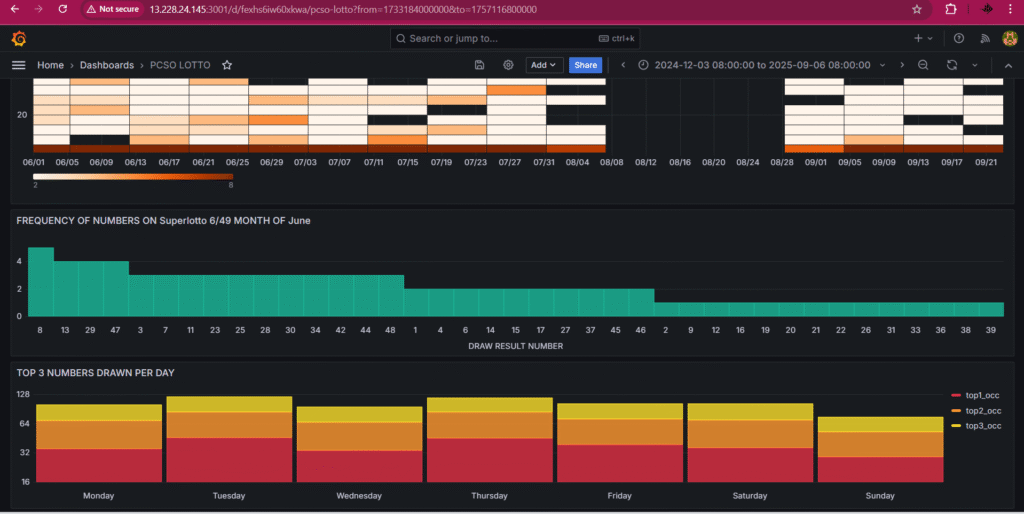
This project demonstrates a complete data pipeline for automating web scraping, data storage, and visualization. The pipeline collects daily lotto results, processes them through an ETL workflow, and stores them in AWS RDS for analysis.. The dashboard is designed to present the latest daily results for each lotto game. It allows users to analyze outcomes by date, game, and individual number, making it easier to track trends, patterns, and historical performance over time.
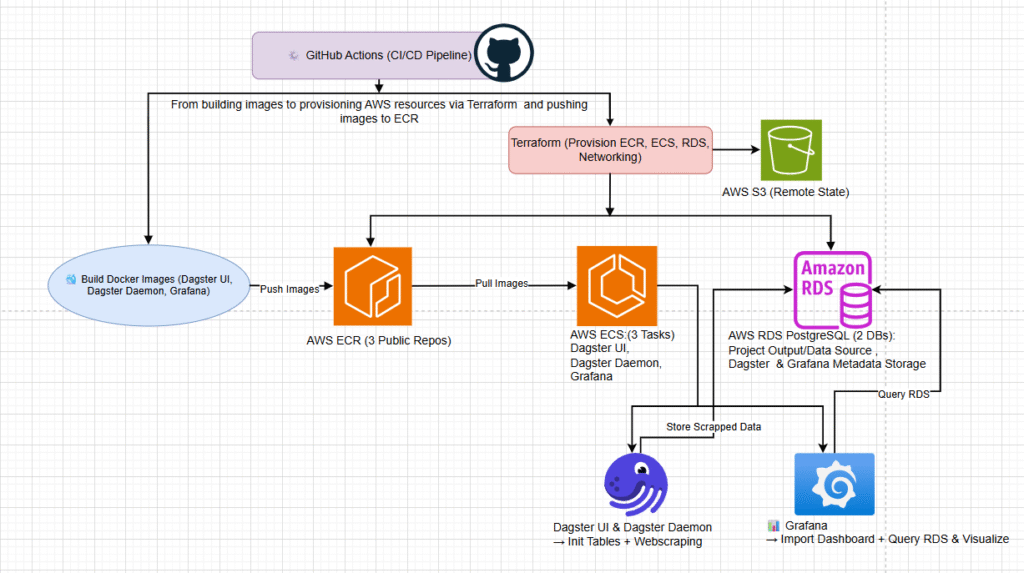
This project is containerized using Docker and consists of three main images:
- Dagster UI
- Dagster Daemon
- Grafana
Deployment and automation are handled through a GitHub Actions CI/CD pipeline, which covers:
- Building Docker images
- Provisioning AWS resources via Terraform
- Pushing images to Amazon ECR
- Refreshing ECS tasks to pull the latest versions
Infrastructure is provisioned with Terraform, which sets up the following AWS resources:
- 2 Amazon RDS PostgreSQL databases
- One for project outputs and as a data source for Grafana
- One for metadata storage for both Dagster and Grafana
- 3 Amazon ECS tasks (Dagster UI, Dagster Daemon, Grafana)
- 3 Amazon ECR repositories for storing Docker images
Once the infrastructure is ready:
- Docker images are uploaded to Amazon ECR.
- ECS tasks are refreshed to pull the latest images.
- Dagster is accessed via the ECS task endpoint to initialize tables and execute web scraping.
- Finally, Grafana is connected to RDS, the dashboard is imported, and the pipeline visualization is completed.
One of the first challenges I encountered was in transforming the raw scraped data into a format suitable for storage in the database. This required building processes to clean, structure, and validate the data to ensure it could be consistently integrated with downstream systems.
Later on, I faced a more complex issue with website scraping. When the target site updated its security, my initial setup stopped working because of Akamai protection. Although switching to Playwright with stealth mode solved the problem locally, it failed once deployed in Dagster on AWS. After troubleshooting, I discovered that the problem was due to geo-blocking in the us-east-1 region. By redeploying to a different AWS region, I was able to bypass the restriction and restore stability to the scraping workflow.
Finally, while creating dashboards in Grafana, the challenge was identifying which visualizations would deliver the most value. It wasn’t just about displaying data, it was about selecting the right charts and graphs to make insights clear and actionable. Through iteration, I was able to refine the dashboards into something both functional and user-friendly.